About WD Gann
W.D. Gann (1878-1955) is a prominent figure in the field of technical analysis. W.D. was born on June 6, 1878, on a cotton farm in Lufkin, Texas. Gann boasted outstanding mathematical skills from an early age. Although it began with a “hope, fear and greed” approach to trading that proved unsuccessful, Gann’s journey ultimately led him to recognize that markets adhere to distinct mathematical laws and time cycles.
Intrigued by the relationship between price and time, which he called the “square” of price and time, Gann embarked on a ceaseless quest to understand. His dedication extended to travel around the world, including visits to England, India, and Egypt, where he explored mathematical theory and historical price data.
Gann’s work is painstaking, with thousands of charts covering daily, weekly, monthly and annual prices of various stocks and commodities. His research goes back even centuries. In an age dominated by fundamental analysis, Gann’s innovative theories were based on mathematical principles, time cycles, and the firm belief that past market behavior predicts future movements.
W.D Gann’s Law of Oscillation
In the course of his scholarship, W.D. Gann introduced the concept of “Law of Oscillations”. He said all stocks and commodities are subject to tremors. This law assumes that it is possible to predict future price movements of an asset by calculating its rate of oscillation. In particular, Gann angle theory is rooted in this basic concept.
Gann Price vs. Time Square & Gann Angle
Among Gann’s significant discoveries, the squaring of price and time emerges as one of the most pivotal. In his trading course, he emphasized that adhering to the rule of observing instances when price aligns with time or when time and price coincide allows for more accurate forecasts of significant trend changes. This principle underscores the profound interplay between price and time in market analysis.
Squaring Price with Time:
This entails achieving a balance between an equal number of points moving up and down, aligned with an equivalent number of time periods, be it days, weeks, or months. Gann recommended squaring not only the range but also low and high prices.
The Intersection of Price and Time:
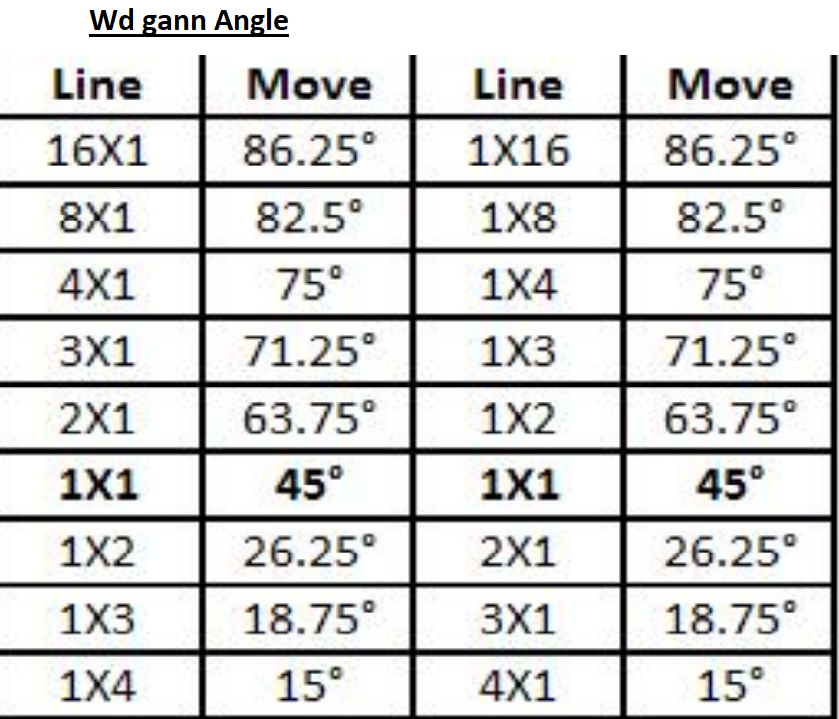
Gann meticulously charted the relationship between price and time. He expressly conveyed that at the juncture where the price and time trend lines intersect, a compelling rationale exists for anticipating a change in trend. Gann delineated 11 distinct trend lines, each serving as a guiding tool for traders to make well-timed decisions. These trend lines are constructed based on geometric angle proportions within the X and Y axes, enabling traders to navigate the market with greater precision.
WD Gann Angle

A raw Gann angle is a 1X1 angle and is pronounced “one by one”. This straight line, when drawn on a price-time chart, makes a 45° angle to the . This is especially true on a semi-log scale. Likewise, a 2X1 (pronounced “two for one”) trendline refers to a scenario where a two-unit price movement occurs in a single time period.
When starting from a low price point and extending to a high price, this trend line has a geometric angle of 63.75° with respect to the About the X axis. These Gann angles provide traders with an invaluable tool, enabling accurate market analysis and decision making.
