The subject matter concerning astrology is quite extensive, to say the least. Part of the
problem is that it requires a great deal of study to familiarize yourself with the position
and mathematics of our solar system. In addition, there is the question of whether to use
geocentric (Earth-centered) or heliocentric (Sun-centered) astrology. The answer to this is that
both must be analyzed in order to be prepared for the unexpected.
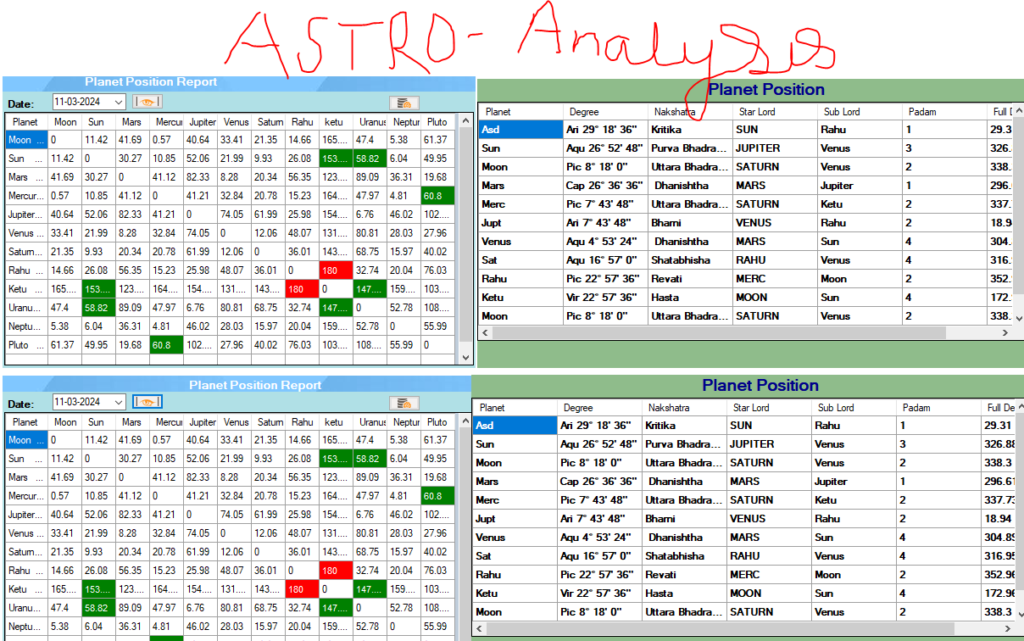
The use of the computer software program “Blue-Star” from Matrix software has enabled
the student of astrology to condense hundreds of hours of research into a more manageable
time frame. This software program allows you to retrieve historical data based on the position
of the planets. It is then necessary to go to past price charts and statistically verify what had
precluded.. It was well worth the effort! Several of my colleagues questioned why I would share
this information. My only response was that very few people would take the effort to learn how
to use it in the market. I rmly believe that most good trading systems are sabotaged by the
psychological weakness of its user. What is presented here is not a trading system and it should
not be used as such. The material here is based on geocentric positions of the planets Venus and
Uranus and their effect on short term trend changes in the stock market.
The two planets possess the unique Fibonacci relationship of .618! Figure I shows the
relationship of Venus and Uranus when they are on opposite sides of the Earth or in opposition
(180 degrees). This is how it would appear from the Earth looking into the sky. It takes 255 days
for Venus and Uranus to make a complete cycle from conjunction (0 degrees) to conjunction
(0 degrees). If we take 365 days and multiply it by .618 the answer is 255 days. When I first
saw this relationship it was apparent that the cyclical implications would by revealing because
of the Fibonacci number sequence.
Donald Bradley, in Stock Market Prediction by Llewellyn Publications, mentioned this
effect on stock prices when Venus and Uranus were at certain critical degrees (aspect).
After studying this phenomenon for many months, certain things became apparent from
the trader’s viewpoint:
FIRST: The aspects were so accurate as a short term trading timing device that it could
be used trading stock index futures (636 aspects were tested accurate to 92 percent plus
or minus two days).
SECOND: The sample size was excellent! Over 60 aspects in a 90-year period from
1898-1987.
THIRD: Some aspects were associated with bullish price action, and others with bearish
price action.
FOURTH: It was usually a short term (three to ten day) trend change, but more than 50
percent of the time the effect lasted several weeks.